
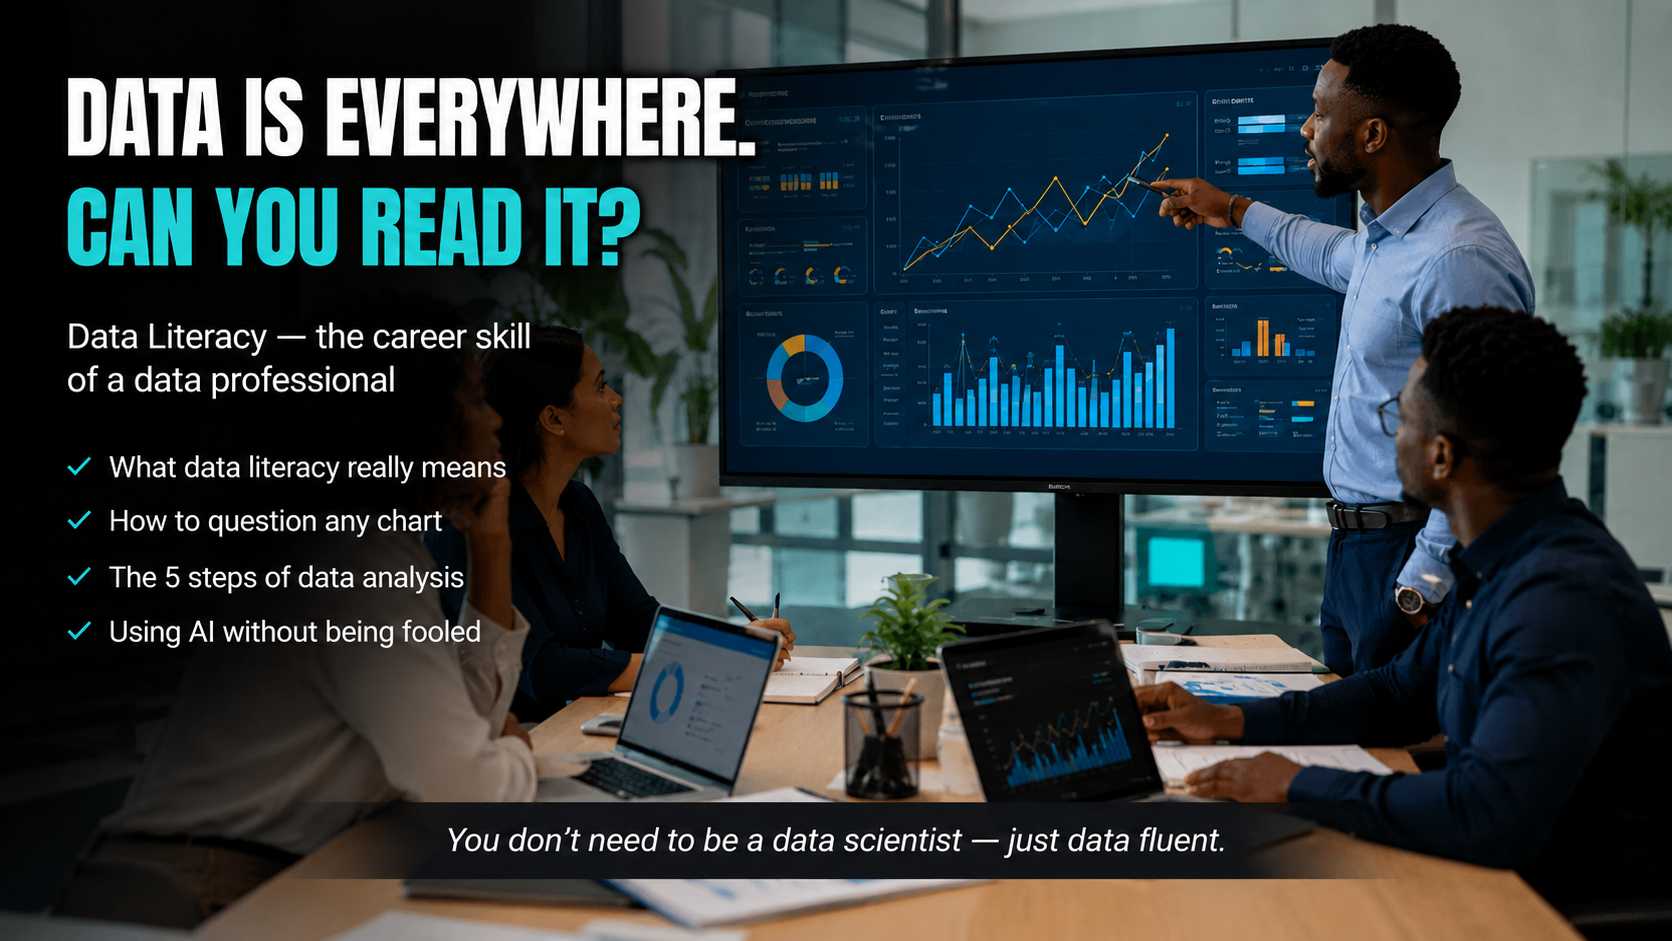
We live in a world drowning in data. Every click, purchase, sensor reading, and social media post adds to an ocean of information estimated at 2.5 quintillion bytes generated daily. Yet having data everywhere is not the same as understanding it. That gap between the data we produce and our ability to make sense of it, is exactly what data literacy exists to close.
What Is Data Literacy?
At its simplest, data literacy is the ability to read, understand, analyze, and communicate with data. Data itself is just a collection of information, that is any piece of information you can collect, analyze, and interpret to make decisions. Data literacy is what transforms that raw material into insight.
Importantly, data literacy is not the same as being a data scientist. You don't need to build machine learning models or write complex code. What you need is the confidence to look at a chart, a report, or a dashboard and ask the right questions: Where did this data come from? What is it actually measuring? Can I trust it? What decision should it inform?
Why It Matters More Than Ever
Data literacy has quietly moved from "nice to have" to baseline expectation. According to DataCamp's 2026 State of Data & AI Literacy Report, which surveyed over 500 enterprise leaders in the US and UK, 88% of leaders now consider basic data literacy important for day-to-day work, by placing it alongside writing and project management as a fundamental professional skill.
Yet the same research exposes a striking gap: 60% of those leaders report a data skills shortage in their own organizations, and only around 42% provide foundational data literacy training at scale. Leaders identify real business consequences from this gap, including reduced productivity, inaccurate decisions, slower decision-making, and stalled innovation.
The payoff for closing the gap is equally clear. Organizations that pair their technology investments with structured, workforce-wide literacy programs are nearly twice as likely to report significant returns on their AI investments. Data literacy, in other words, is not just an individual career asset, it is an organizational multiplier.
The Language of Data: Key Concepts to Know
One of the fastest ways to become more data literate is to learn the vocabulary. A few foundational distinctions go a long way:
Quantitative vs. qualitative data.
Quantitative data is numerical and directly measurable, that is sales figures, temperatures, response times. Qualitative (or categorical) data is descriptive, capturing non-numeric characteristics like opinions, behaviors, experiences, and attitudes. Good analysis often blends both.
Structured vs. unstructured data.
Structured data is organized in a clear, defined format, typically rows and columns — think spreadsheets and databases. Unstructured data lacks any built-in organization: emails, videos, social media posts, free-text survey responses. Most of the world's data is unstructured, which is one reason "big data", whic refers to datasets too large, fast, and varied for traditional systems, has become such a challenge.
Where data comes from.
Data can be internal (generated within your organization, used to track operations and performance) or external (generated outside it, offering context on markets, customers, and competitors). It can be primary (collected firsthand through surveys, experiments, or interviews), secondary (collected by someone else for their own purposes), or even syndicated, which means data gathered by research firms and sold to multiple organizations. Open data, freely published by governments and research institutions, adds another rich source.
The Data Analysis Process: Five Steps
Data literacy also means understanding how analysis actually happens. The process typically follows five steps:
- Prepare for analysis. Define your objectives, understand what's needed, and create a plan. Analysis without a clear question is just wandering through numbers.
- Gather the data. Collect the data needed to address those objectives, whether from internal systems, external sources, or fresh collection.
- Manipulate the data. Transform, clean, and prepare the collected data. Messy input produces unreliable output — a truth that matters even more as AI tools automate analysis downstream.
- Analyze the data. Apply statistical and analytical techniques to uncover patterns, trends, and insights.
- Interpret the results. Make sense of what the analysis reveals and translate it into decisions and action.
Knowing these steps helps you engage intelligently with analysis even when you're not the one performing it. If someone presents you with a conclusion, you can ask what the objective was, how the data was gathered, and how it was cleaned.
The Toolkit: From Spreadsheets to AI
Data literacy doesn't require mastering every tool, but knowing what exists helps:
- Data storage tools and databases save information for future use, with database management systems (DBMS) providing the software to organize and manipulate them. SQL (Structured Query Language) remains the standard way to search, filter, combine, and summarize data stored in databases.
- Data warehouses combine data from multiple sources into a single system optimized for reporting and trend analysis, while data processing platforms handle datasets too large for traditional tools.
- Data visualization tools convert raw numbers into charts, graphs, and maps, making patterns easier to spot. Dashboards consolidate key performance indicators (KPIs) into real-time views. But visualization literacy cuts both ways: you also need to read charts critically. Truncated axes, misleading dual-axis charts, and pie charts misused for time series are common in professional settings — and often accepted without question.
- AI-powered analytics use machine learning to detect patterns, make predictions, and automate insights. Their rise makes literacy more important, not less: 72% of enterprise leaders now consider AI literacy essential too, and the most valued skills are not building models but knowing how to direct AI tools, validate their outputs, and question results rather than accepting them uncritically.
The Quality Question: Trusting Your Data
Perhaps the most underrated dimension of data literacy is skepticism. Data can fail you in several ways:
- Data inaccuracy — when data doesn't match the real-world condition it represents.
- Data incompleteness — when the data you need simply isn't there.
- Data bias — when data is skewed or unfair because of how it was collected, sampled, labeled, or interpreted. This matters enormously in the age of AI, since biased inputs quietly become biased predictions.
- Data overload — when the sheer volume of data overwhelms the people and systems handling it, drowning signal in noise.
A data-literate person doesn't just consume data; they interrogate it. "The number looks good" becomes "What does this number really mean, and can I trust how it was produced?"
How to Build Your Own Data Literacy
The good news: this skill is learnable, and you can start today.
- Learn the fundamentals. Get comfortable with core vocabulary (like the terms above) and basic statistical concepts — averages, percentages, growth rates, and why an average alone can mislead.
- Practice reading visualizations. Look at charts in news articles and reports and ask what they show, what they hide, and whether the chart type fits the data.
- Get hands-on with tools. Spreadsheets like Excel or Google Sheets cover a surprising share of everyday data work. From there, explore visualization tools like Tableau or Power BI, and eventually SQL or Python if your role demands more.
- Apply it immediately. Data literacy sticks when used. Question a metric in your next meeting. Rebuild a chart with better design. Trace a KPI back to its source.
- Pursue structured learning. Free programs — such as IBM SkillsBuild's Data Literacy pathway, DataCamp courses, or Khan Academy's statistics modules — offer guided paths and credentials that signal your skills to employers. And that signal is worth something: research suggests most leaders are willing to pay more for candidates with strong data skills.
The Bottom Line
Data literacy is no longer a specialist's skill — it's a citizen's skill. In an era of AI-generated content, misinformation, and dashboards on every desk, the ability to read data critically, question it intelligently, and communicate it clearly separates those who are led by numbers from those who lead with them.
You don't need to become a data scientist. You just need to become fluent enough to ask: What is this data really telling me — and what is it not? That single habit, practiced consistently, may be the most valuable professional investment you make this decade.
Sources & Further Reading
- IBM SkillsBuild, Data Literacy course glossary
- DataCamp, The State of Data & AI Literacy in 2026
- DataCamp, The Data Literacy Skills Gap in Enterprise
- DataCamp, What is Data Literacy? A Guide for Data & Analytics Leaders
- Data Business Central, Top 10 Data Literacy Skills Every Business Professional Needs in 2026
- Atlan, What is Data Literacy? Importance and Benefits





Comments